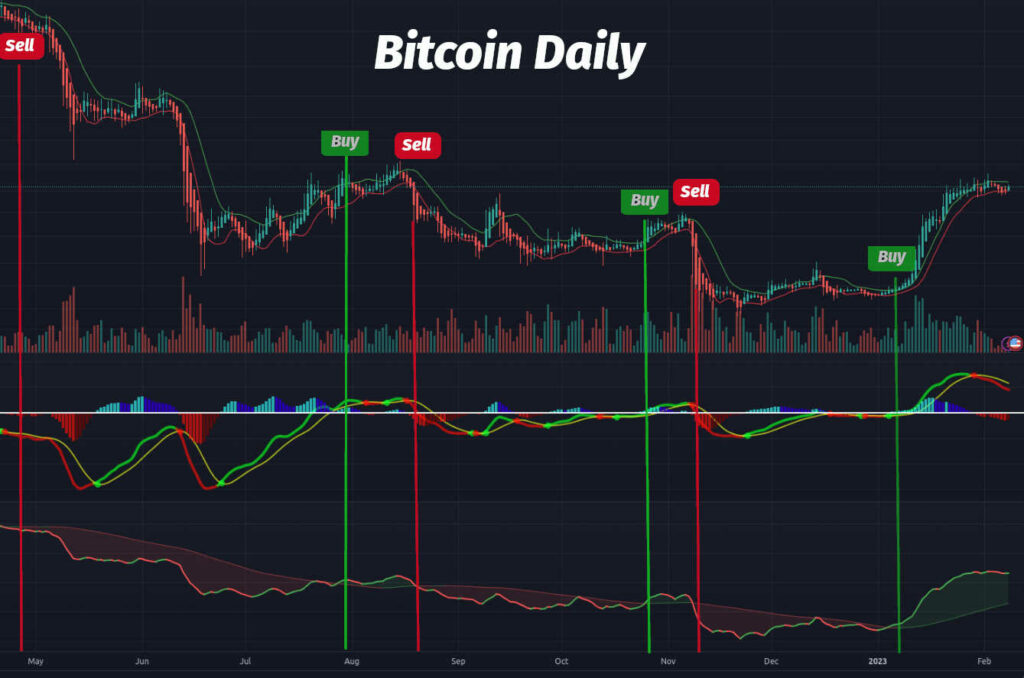
Below are my Bitcoin trades over the last six months. When trading long, I exit when the Sell Signal appears. When trading short, I exit when the Buy Signal appears. To learn how to read the signals, join my free Discord server or look for TA under Trading.
Recent Bitcoin Price Performance (2023-02-08)

The chart above is one of my favorite TA models for predicting price momentum. It is accurate on all time-frames. The chart above is a daily chart, but this model is also accurate on the hourly chart, the 4-hour chart, the daily chart and so on. This TA model was recently presented in my Sunday class entitled “Three of my top Technical Analysis Strategies for Crypto.” This class is available on-demand in my VIP membership. Get a 30-day free trail for my VIP membership.
On February 8, 2023, Bitcoin saw the occurrence of the coveted golden cross on its daily chart. This is an exciting moment for BTC, marking a turning point for those who have the foresight and courage to take advantage of it.
BTC broke out on January 5th, flashing a strong buy signal. And, it is showing no sign of letting up. With the stock market experiencing a slowdown, Bitcoin is on the rise. With its decentralized, secure and borderless nature, it’s clearly becoming the investment of the future. Don’t be left behind in the past. Invest in BTC now and watch your wealth grow. Don’t wait for tomorrow – take control of your financial future today.
Disclaimer: Not financial advice! Investing in cryptocurrency involves risks, including fluctuating prices, uncertain regulatory environments, and security vulnerabilities. It is important to do your own research and to understand the potential risks before investing in cryptocurrency. You should also consult a qualified professional to better understand the potential risks before making any investment decision.
